gSwoop is a powerful GPS analysis tool that was designed with one objective: to help swoopers evaluate and improve their performance. Whether you have just started swooping or you're a seasoned competitor with years of experience gSwoop will accelerate your learning curve and help you improve faster with fewer jumps.
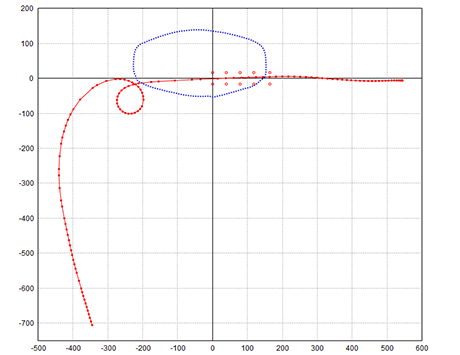
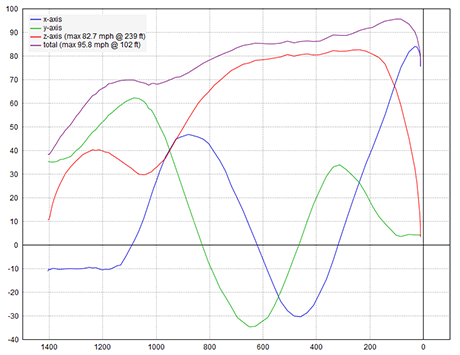
gSwoop has been actively developed since 2010 using GPS data from over 1000 jumps by a dozen pilots. Ease of use has been a primary consideration. You will only need a few minutes between jumps to evaluate your swoops. Just drag and drop your GPS files and gSwoop will do all the work: detecting the swoop, drawing plots, and generating metrics such as turn height, rollout height, maximum speed, degrees of rotation, distance swooped, and speed carve time.
The GUI provides an interactive interface that makes it easy to analyze all aspects of your swoop. Open multiple swoops and quickly scroll between them or overlay the plots to identify subtle differences between swoops. This has proven to be very effective when experimenting with changes to technique, canopy type, and wing loading. You can also compare your swoops to those of other pilots to see what they are doing differently.
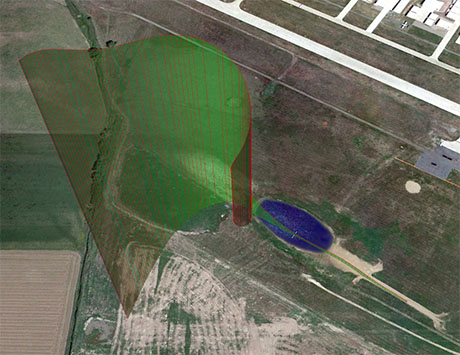
Training (or competing) with gates will unlock the full capabilities of gSwoop. Sophisticated algorithms precisely determine the position and orientation of the entry gate which is then used as a reference for all metrics and plots. gSwoop will automatically detect the type of run (distance versus speed) and draw the correct course markers on your plots. Your distance and speed scores will also be calculated from the GPS data. This provides essential feedback during training and alerts you to scoring errors during competition.
Head over to the example metrics and plots for a closer look or download gSwoop and try it out with the demo files.