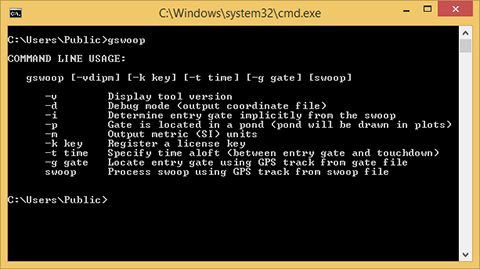
GUI (graphical user interface):
Launch the gSwoop GUI using the shortcut icon on your desktop (Windows) or from the Launchpad (OS X). If you have a license key you can register it using "Help->Register".
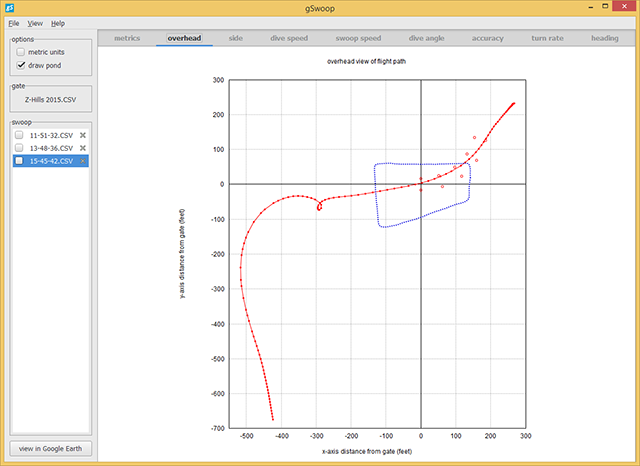
The easiest way to open a GPS file of your swoop is to drag and drop the file (or files) into the gSwoop window. The files will be analyzed immediately and the output will be displayed using multiple pages in the main "notebook" window. Use the tabs at the top of the notebook to navigate between the metrics and various plots. By default the plots will be displayed 4 per page but you can zoom in or out using Ctrl-plus and Ctrl-minus (or use the "View" menu).
You can open more than one swoop at a time. The "swoop" window on the left displays a list of open swoops and you can use your keyboard or mouse to quickly scroll between them. The selected swoop will be highlighted in the list and drawn in red on the plots. Use the checkboxes to the left of each filename to overlay multiple swoops. Swoops that are checked (but not selected) will be drawn in grey on the plots.
If you have a gate file you can open it using "File->Open gate...". When a gate is open you will see course markers and the outline of the pond on the overhead plots. Note that all open swoops must be compatible with the open gate. That means the gate and the swoop must be located in the same landing area. If you try to open an incompatible gate or swoop you will be prompted to close one or the other.
If you have installed Google Earth you can display a 3-dimensional view of your swoops using the "view in Google Earth" button on the bottom left of the gSwoop window. The first time you click the button Google Earth will be launched and the selected swoop will be displayed on the map. If you select another swoop and click the button again the new swoop will be added to the existing Google Earth window. You can use the controls inside Google Earth to zoom, pan, rotate, select and deselect tracks.
An optional time scale can be displayed by checking "View->Time scale". The time scale represents time elapsed during the swoop. When the scale is displayed a marker will be drawn on each of the plots that corresponds to the time selected on the scale. This is useful for correlating points between plots (for example, what was your heading during a particular spike in turn rate). You can move the scale slider manually or you can click the play button and the swoop will be "played back" in real time.