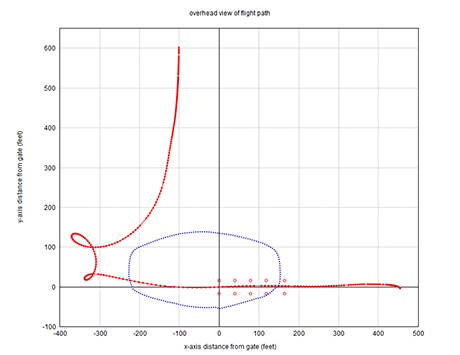
overhead view of flight path:
The blue outline represents the perimeter of the pond.
The red circles represent gate markers (laid out as specified for IPC distance and
zone accuracy). In this example we can see that a 630 degree turn was executed
starting 100 feet behind the gate and 550 feet offset. There were two "snaps" in
the turn and the rollout was 350 feet behind the gate and 25 feet offset.
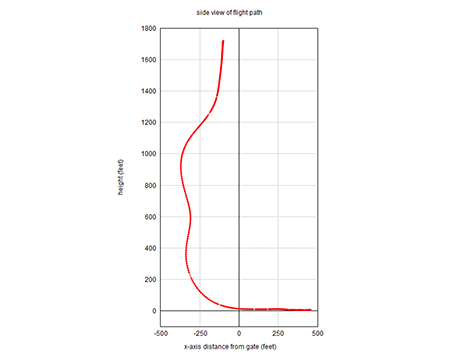
side view of flight path:
This angle provides a good view of the rollout and shows how steep and tight
to the gate the pilot was during the approach. We can also see how high above
the gate the maneuver was initiated (1700 feet in this example).
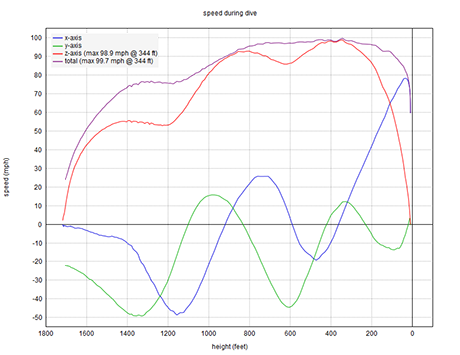
speed during dive:
This is a key plot that shows the different speed
components (x-axis, y-axis,
z-axis, and total) during
the speed building maneuver. The z-axis (vertical)
speed is most important because it shows how power was built (and lost) during
the turn.
This example demonstrates the difficulty generating and maintaining power during
a bigger turn. There are three humps where the speed peaked. The first hump was
during double front riser input (55mph peak). The second hump was during the snap
at 270 degrees (92mph peak). The third hump was during the snap at 630 degrees
(99mph peak). Some vertical speed was lost between the peaks but the
total speed (which combines all components) shows
that most vertical speed lost here was converted to horizontal speed. You need
to be careful interpreting horizontal speeds, however, because wind can
significantly influence them.
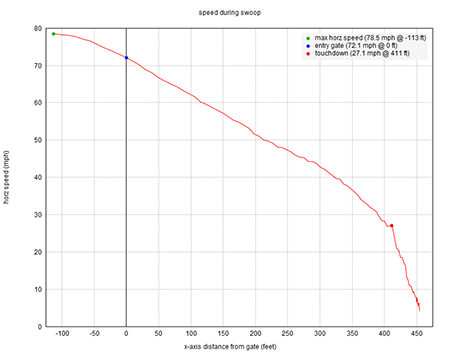
speed during swoop:
This plot shows horizontal speed (combined x-axis and y-axis) during the plane
out and swoop. In this example horizontal speed peaked at 79mph and entry gate
speed was 72mph. Horizontal speed decreased gradually during the swoop until
touchdown at 27mph (400 feet past the gate). Motion didn't stop until 450 feet
(due to the slide or run out).
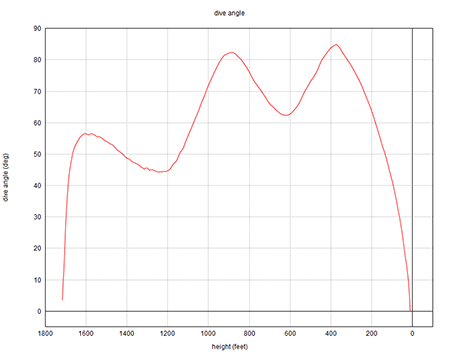
dive angle:
This plot shows the dive angle during the turn/dive (90 degrees
is straight down). The three humps correspond to the front riser dive and the
two snaps in the turn.
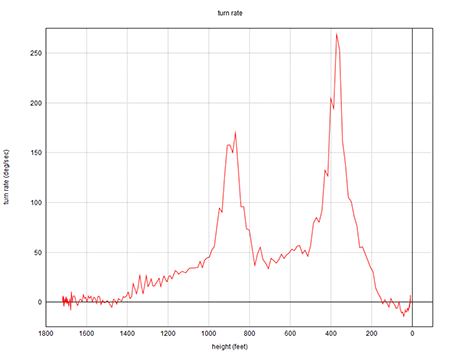
turn rate:
In this example the turn rate was zero until 1400 feet (which marks the start
of the transition off double front risers). The two spikes correspond to the
snaps in the turn. The first snap occured at 900 feet and the second snap
(faster than the first) occured at 400 feet. The height of the last snap
is a key data point because it determines the character of the rollout. Too
high and you will lose speed due to excessive time in the rollout. Too low
and you will lose speed due to excessive riser or toggle input.
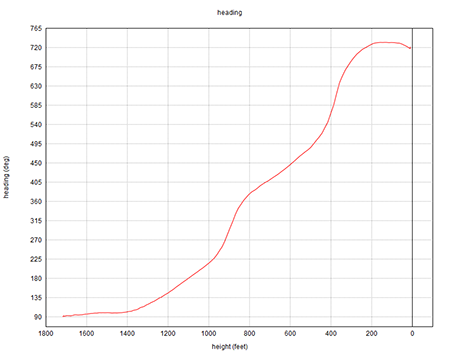
heading:
This plot shows the heading (direction of flight). The heading is 0 degrees
when flying directly towards the gate. In this example the pilot was facing
the gate at 800 feet and again at 200 feet (270 degrees and 630 degrees into
the turn, respectively).